Error loading page.
Try refreshing the page. If that doesn't work, there may be a network issue, and you can use our self test page to see what's preventing the page from loading.
Learn more about possible network issues or contact support for more help.

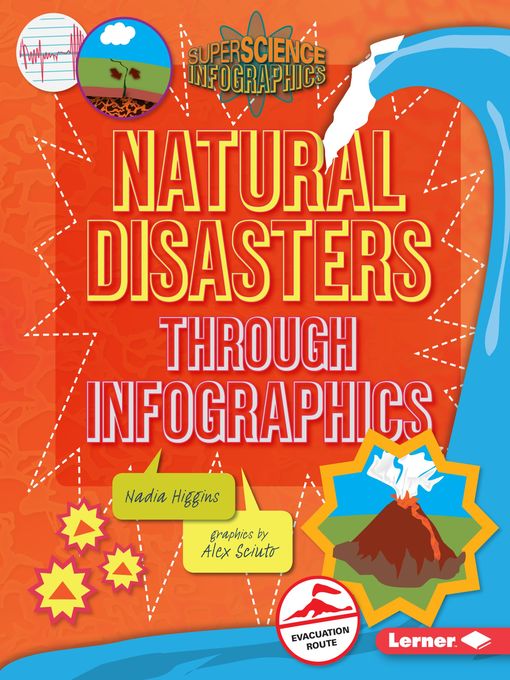
Natural Disasters through Infographics

ebook
1 of 1 copy available

The facts about natural disasters are so big and devastating they could make your head explode! You hear about huge costs (like the $360,000,000,000 in damage caused by the 2011 tsunami in Japan), huge speeds (the fastest-moving tsunami waves have been recorded at 500 miles per hour), and even huger mysteries (where, exactly, the danger zones are for natural disasters).

How can all these big numbers and concepts make more sense? Infographics! The charts, maps, and illustrations in this book tell a visual story to help you better understand key concepts about natural disasters. Crack open this book to explore mind-boggling questions such as:

  • How can scientists accurately predict natural disasters?

  • What were some of Earth's biggest, freakiest, and deadliest disasters?

  • How can you protect yourself in the event of a volcano, an earthquake, or a tsunami?

    The answers are sure to shake you up!

    • Creators

    • Series

    • Publisher

    • Release date

    • Formats

    • Languages

    • Levels

    • Reviews

      • School Library Journal

        November 1, 2013

        Gr 3-5-A well-designed infographic simultaneously conveys facts and presents their interrelationships in visual ways. With but rare exceptions (such as a graph of multiple star characteristics in Solar System, a representation of the water cycle in Weather, and the occasional pie chart elsewhere), the silhouettes and other figures in these volumes may be done in a pictorial graphic style but are really just illustrations or images inserted to add visual interest. However, each title does offer sheaves of basic information in particularly concentrated form, including topic-expanding closing spreads ("10 Ways to Live Green" in Life Science, for instance), and the resources lists are above average.

        Copyright 2013 School Library Journal, LLC Used with permission.

      • Booklist

        October 1, 2013
        Grades 3-5 This introduction to seismic events, from earthquakes to tsunamis, features brightly colored illustrations that give the title high visual energy. Along with maps showing tectonic plates and the locations of various hot spots and historical catastrophes, the images include schematic views of four kinds of volcanoes, quake-resistant features in San Francisco's Transamerica Pyramid, and demonstrations of how the shape of a tsunami changes as it rolls over a continental shelf. Short descriptions of record-breaking disasters, the earth scientists who study their causes, survival techniques during disasters, and other high-interest topics are interspersed throughout the spreads. Eye-catching but limited in scope and level of detail, this entry in the Super Science Infographics would be best read as a supplement to more comprehensive titles, such as Claire Watts' Natural Disasters (2012) and Lydia Bjornlund's Natural Disaster Research (2012).(Reprinted with permission of Booklist, copyright 2013, American Library Association.)

    Formats

    • OverDrive Read
    • PDF ebook

    Languages

    • English

    Levels

    • ATOS Level:5.3
    • Lexile® Measure:880
    • Interest Level:4-8(MG)
    • Text Difficulty:4-5

    Loading